


Introduction
Contents
- Introduction
- Editor’s Choice
- Types Of Mobile Ads
- General Mobile Advertising Statistics
- By Advertising Spending
- By Share Of Marketing Budget Invested By The Primary Economic Sector
- By Country
- By Region (Audio, Banner, Classified, Influencer, In-app, Search, Social Media, Video and Mobile Advertising)
- By Most Popular Monetization Methods
- By In-App Ads
- By Platforms Of Ads
- Conclusion
Mobile Advertising Statistics: Today, mobile advertising is the most popular way of advertising as 7.1 billion people own a smartphone. The smartphone allows brands to know the consumer attitude and thinking toward a particular product or service and product-targeted advertising. Not only this but the rate of conversion after seeing the ad on mobile is also improved significantly.
Mobile advertising allows targeting specific audiences according to their demographics. It has a wider reach and a comparatively less costly method of modern advertisement. These mobile advertising statistics are gathered with current datasets allowing updated advertising industry knowledge.
Editor’s Choice
- It is estimated that business-to-business (B2B) mobile advertising spending will reach $37.68 billion in 2024, up from $35.02 billion in 2023.
- More than half of the traffic generated on any website comes from mobile devices resulting in 56.86%.
- Mobile Advertising Statistics state that 70% of the total ad spending is projected to be generated through mobile by 2028.
- In global comparison, the United States spends more on mobile advertising than other countries.
- In 2023, businesses in the USA preferred to have the highest average budget for B2C products in the mobile marketing budget segment contributing 28.8%.
- According to Mobile Advertising Statistics 2023, in selected countries, 81% of consumers in the United Kingdom noticed that they received personalized ads about the product, topic, or service they were talking about.
- In 2024, the USA, the largest market by volume, is considered to be valued at $148.2 billion.
- In 2024, the average ad spending per user in the in-app advertising segment worldwide is estimated to be $63.7.
- 79% of customers are ready to share their personal information in exchange for contextualized engagement.
- In total digital ad spends worldwide, mobile ads contribute 64% of ad spend. Furthermore, it is estimated to grow by 2% in the next 3 years.
Types Of Mobile Ads
- In-App Ads – These types of ads appear in the apps. Such advertisements can be removed by paying subscription fees. They appear in any type such as video, native, banner, or playable ads.
- Banner Ads – Banner ads are either animated or non-animated ads. They appear at the top or bottom of the screen.
- Playable Ads – As the name suggests, these ads can be played by hovering the mouse or clicking on the ads. Like video ads, these do not loop.
- Native Ads – Native ads are less disturbing ads. These do not typically disturb the user experience within the app.
- Video Ads – Video ads include, in-app videos, interstitial videos, instream video, and gamified video ads.
General Mobile Advertising Statistics
- It is estimated that business-to-business (B2B) mobile advertising spending will reach $37.68 billion in 2024, up from $35.02 billion in 2023.
- The average cost per 1000 impressions (CPM) in terms of mobile advertising is $7.25.
- Giving mobile coupons is likely to increase customer retention by 10 to 15%.
- In global comparison, the United States spends more on mobile advertising than other countries.
- More than half of the traffic generated on any website comes from mobile devices resulting in 56.86%.
- Mobile Advertising Statistics state that, in total digital ad spend worldwide, mobile ads contribute 64% of ad spend. Furthermore, it is estimated to grow by 2% in the next 3 years.
- 70% of mobile users do not prefer mobile ads.
- 79% of customers are ready to share their personal information in exchange for contextualized engagement.
- In 2024, mobile gaming advertising revenue is roughly valued at $7.9 billion.
- According to Mobile Advertising Statistics, native ads on mobile devices have the highest click-thru rate, 0.38%, compared to desktop ads, which contribute 0.16%.
- Only 1 out of 5 consumers like to see or watch mobile ads.
- By 2027, $4 billion of ad spending is estimated to be consumed through mobile devices only.
- It is said that, after seeing a particular mobile ad, consumers are likely to go to the store immediately.
By Advertising Spending
- There is a 20% year-on-year increase in mobile spending in 2023.
- Compared to the last five years, social media mobile advertising spending by 2028 is estimated to be 3.53%, the highest percentage, compared to desktop advertising, which results in 2.89%.
- By 2030, mobile in-game ad spending worldwide is projected to reach $7.87 billion, with a CAGR of 12% between 2021 and 2030.
- According to Mobile Advertising Statistics, by 2025, the same amount of ad spent is estimated to increase to 235.7 billion with a CAGR of 12%.
- Furthermore, mobile advertising spending worldwide is projected to cross $400 billion in 2024, an increase of 11% from 2023.
- In the USA, the influencer advertising mobile segment is estimated to be valued at $116.57 billion by 2028.
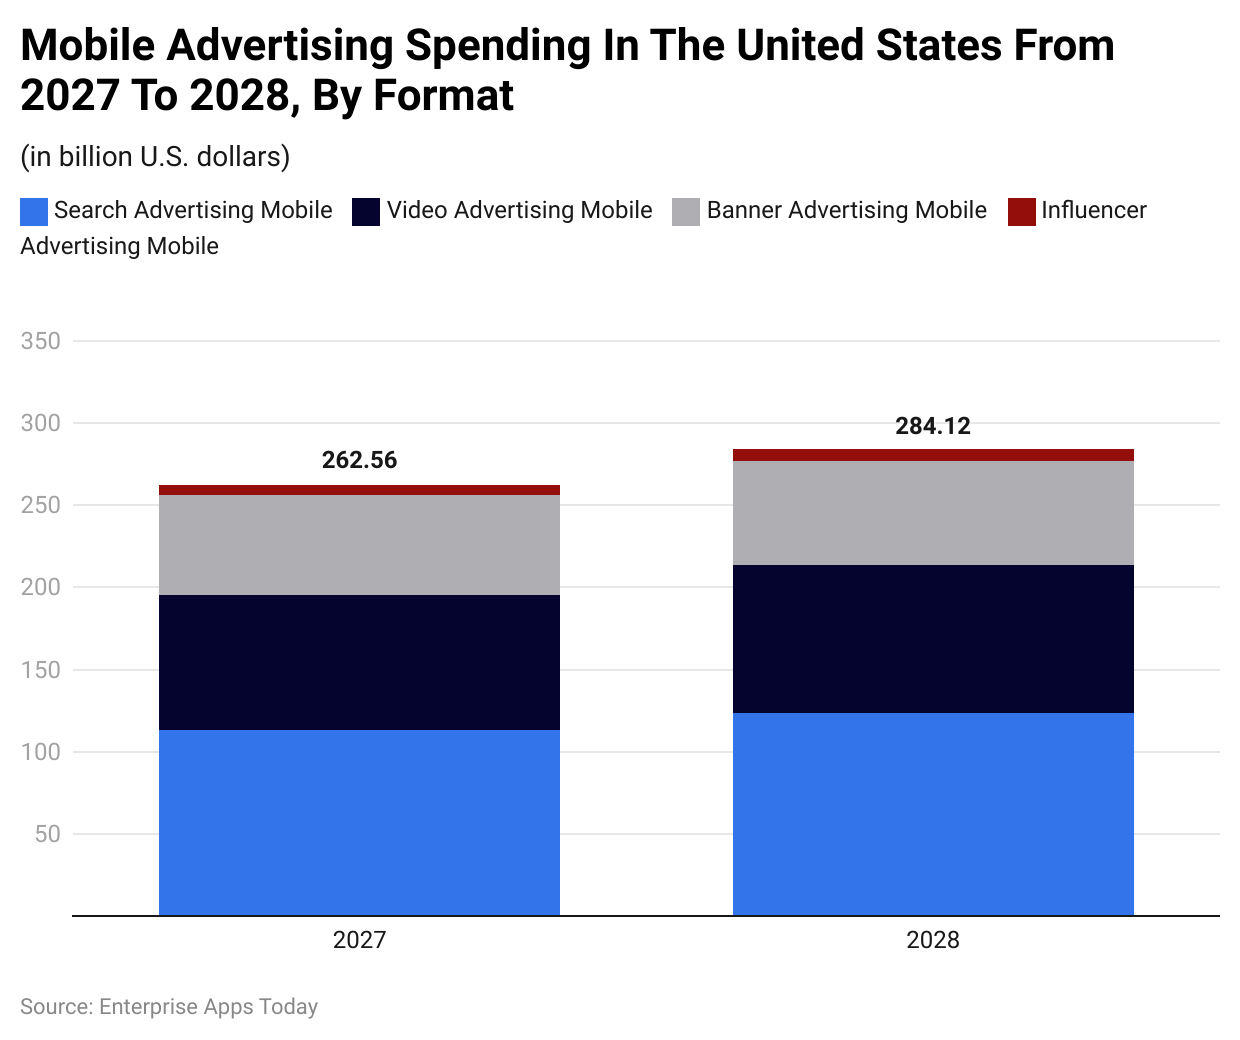
By Format
 (Reference: statista.com)
- Between 2027 and 2028, mobile search advertising is expected to amount to $113.23 billion reaching $123.59 billion by 2028 being the leading segment of all other formats.
- On the other hand, mobile influencer advertising is considered the least ad-spent format with $6.46 billion and $7.02 billion in both mentioned years.
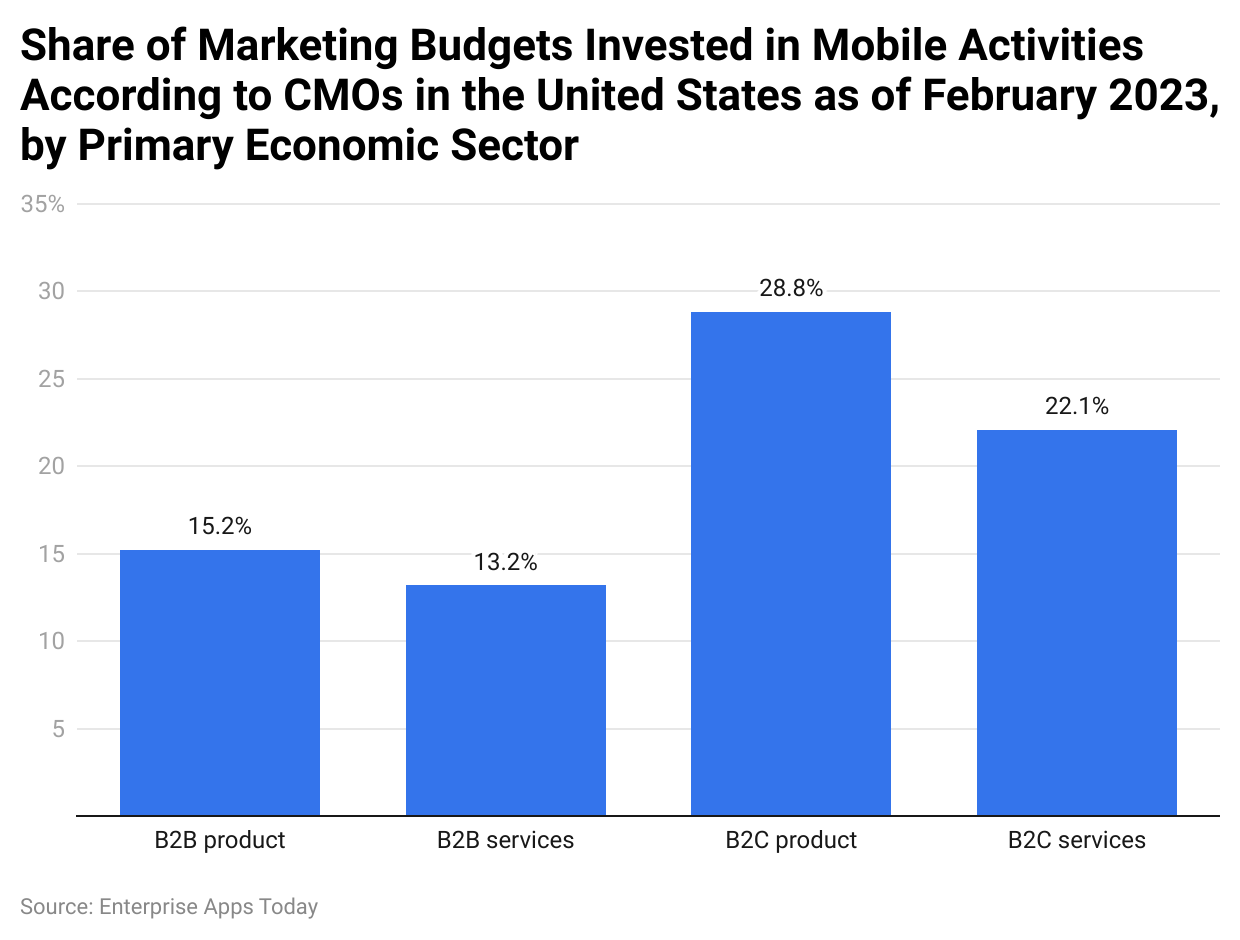
By B2B Business
 (Reference: statista.com)
- In 2023, businesses in the USA preferred to have the highest average budget for B2C products in the mobile marketing budget segment contributing 28.8%.
- B2C services and B2B products had 22.1% and 15.2% allotted budget respectively. However, the lowest budget was allotted for B2B services resulting in 13.2%.
By Country
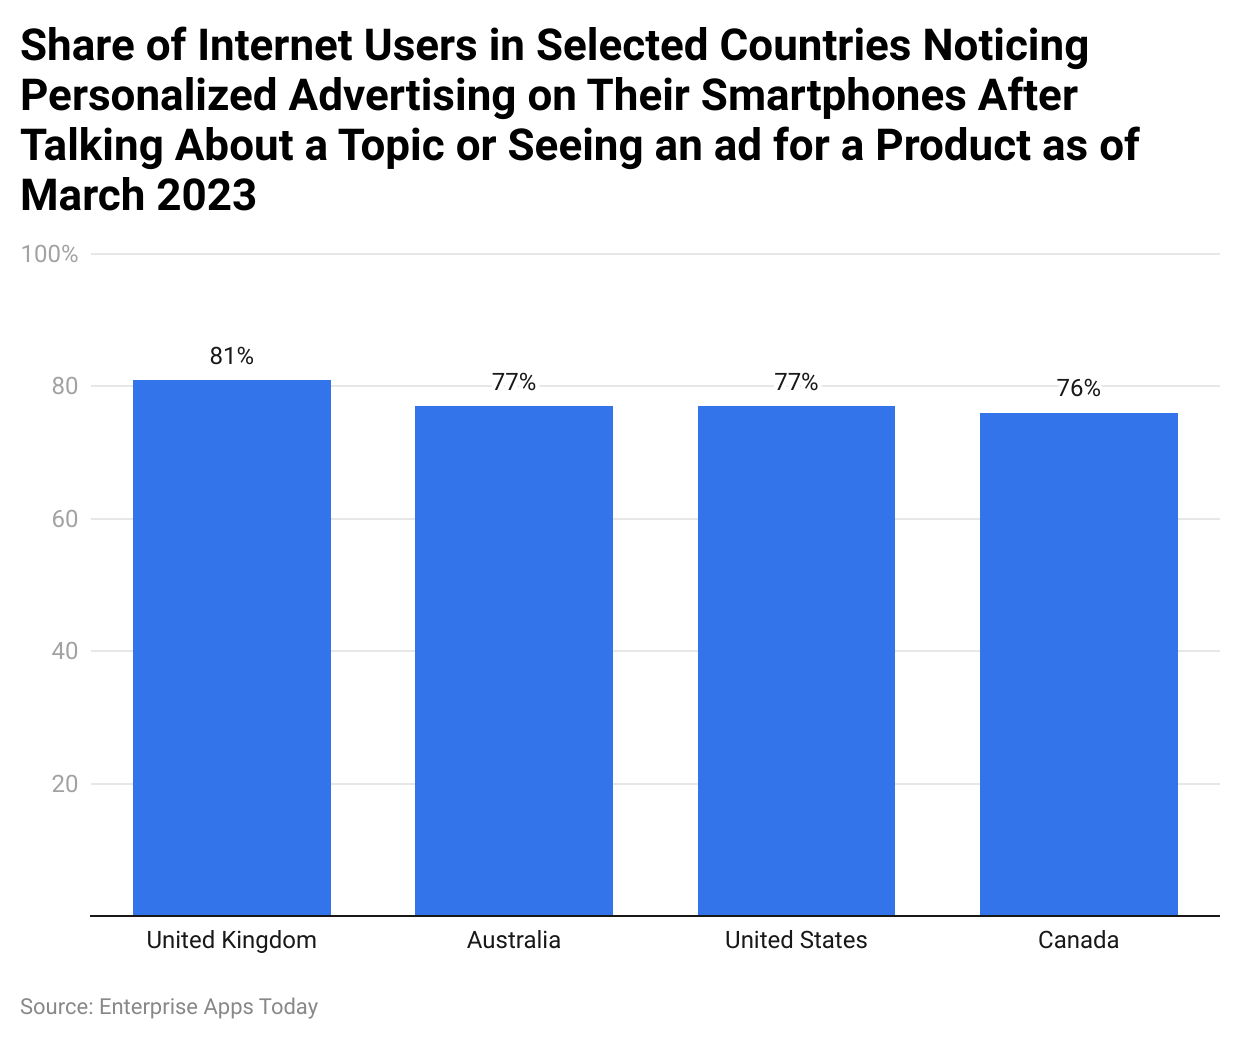
By Share Of Internet Users Noticing Personalized Ads On Their Smartphones
 (Reference: statista.com)
- According to Mobile Advertising Statistics 2023, in selected countries, 81% of consumers in the United Kingdom noticed that they received personalized ads about the product, topic, or service they were talking about.
- Similarly, in other selected countries, 77% in Australia, the USA, and 76% in Canada felt the same.
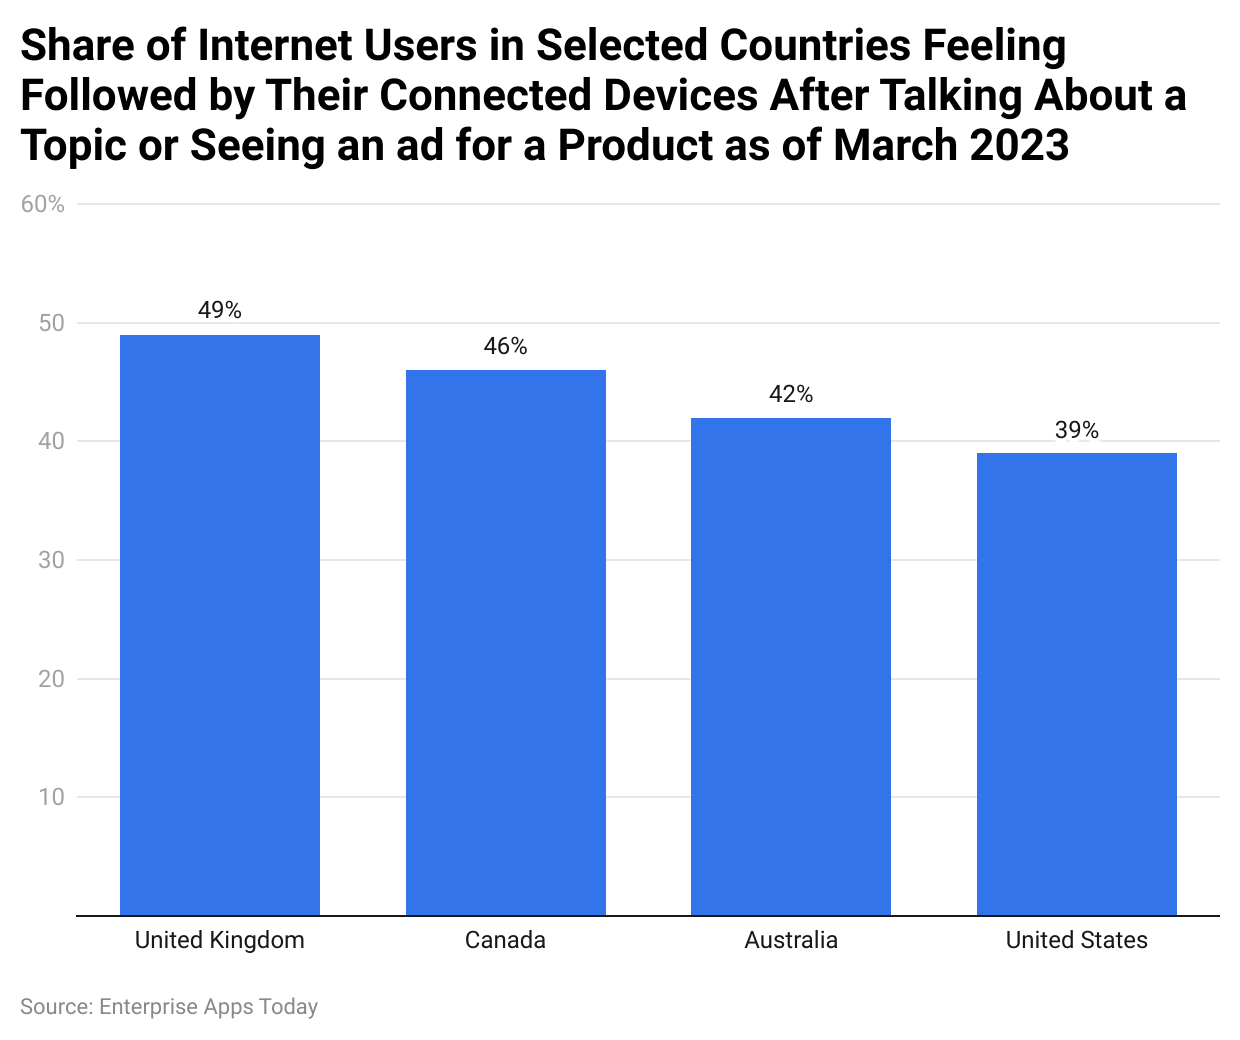
By Feeling Of Being Followed By Connected Devices
 (Reference: statista.com)
The Highest number of users felt their mobile phones or other devices were spying on them after seeing the same ad for a discussed topic or product appear resulting in 49% residing in the United Kingdom, followed by Canada 46%, Australia 42%, and the United States 39%.
By Fastest Growing Digital Advertising Markets
 (Reference: statista.com)
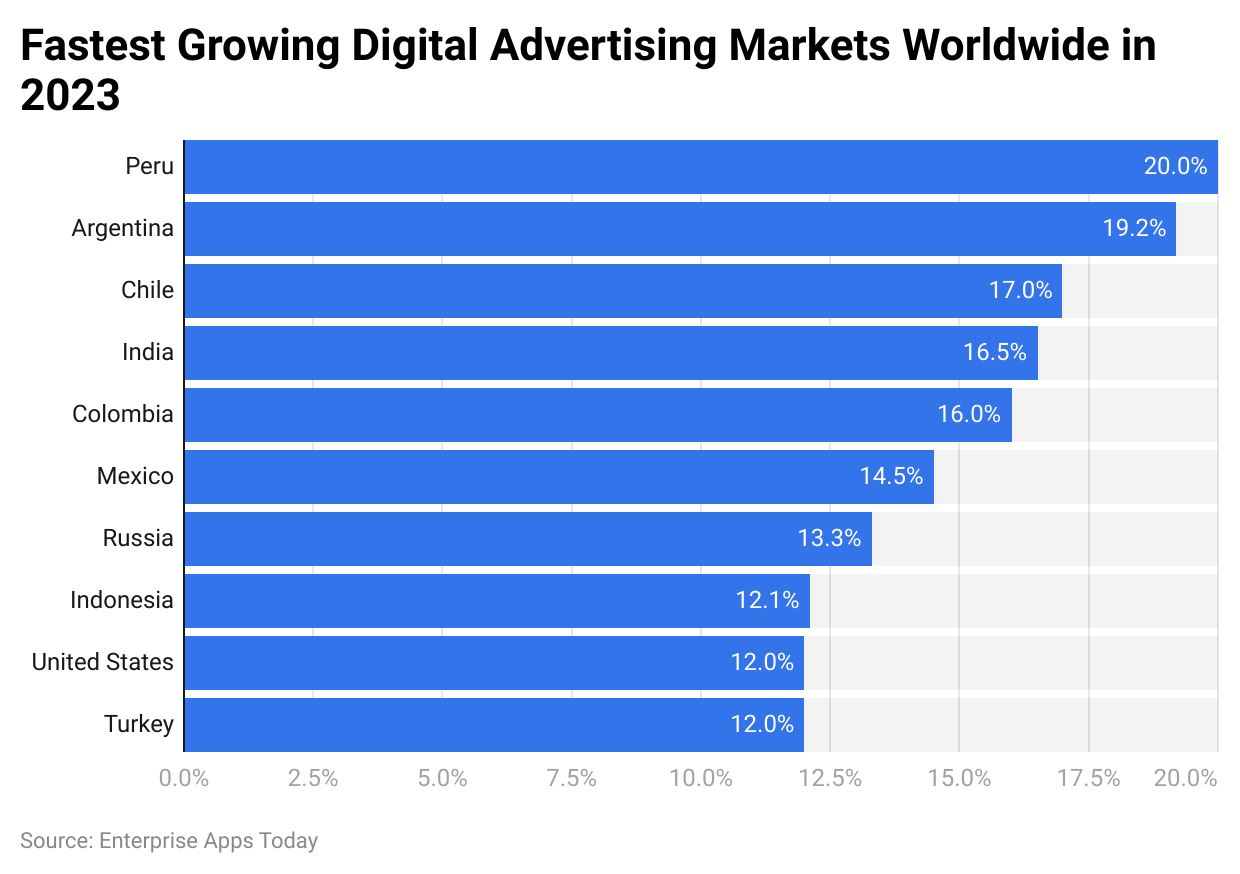
In 2023, Peru was the leading digital advertising market worldwide with the fastest growing rate resulting in 20%. Argentina and Chile were other top countries with the highest growth rate resulting in 19.2% and 17% respectively.
By Region (Audio, Banner, Classified, Influencer, In-app, Search, Social Media, Video and Mobile Advertising)
Worldwide
- Ad spending in the worldwide digital advertising market is estimated to reach $740.30 billion in the current year.
- Compared to other types of digital advertising, search advertising is projected to be the largest market with a volume of $306.7 billion in 2024.
- Mobile Advertising Statistics state that 70% of the total ad spending is projected to be generated through mobile by 2028.
- Furthermore, in 2024, the average ad spending per user in the in-app advertising segment is estimated to be $63.7.
- In the current year, the worldwide ad spending growth is estimated to be 8.9%.
- In 2024, the USA is expected to generate most of the ad spending contributing $298 billion.
Asia
- The Asian digital advertising market is currently valued at $257.3 billion.
- Similarly to the worldwide market, by 2028, 75% of the total ad spending is estimated to be generated from mobile devices.
- Furthermore, as of 2024, search advertising is considered to be the largest segment with a market volume of $88.2 billion.
- In Asia, the average ad spending per user is estimated to amount to $47.4 in 2024.
Americas
- In the USA in 2024, the largest market with volume is considered to be valued at $148.2 billion.
- The average ad spending per consumer in the market is projected to be $174.7 in 2024.
- In the current year, the ad spending growth in the American market is estimated to be 9.7%.
- The mobile advertising segment by 2028 is projected to generate 72% of total ad spending.
Africa
- In 2024, the African ad spending market is valued at $4,408 million.
- Furthermore, the growth of ad spending is expected to be 8.9%.
- By 2028, the majority of the total ad spending will be generated through mobile resulting in 51%.
- Similar to other regions, search advertising is the leading segment with a volume of $1,824 million in 2024.
Australia And Oceania
- In 2024, ad spending growth in Australia and Oceania is expected to be 5.7% and is valued at $15.0 billion.
- 63% of total ad spending by 2028 is projected to be generated from mobile in the digital advertising market.
- The average ad spending per user in the search advertising segment is $231.4 in 2024.
Europe
- The European digital advertising market is estimated to be valued at $127.5 billion in the current year.
- Furthermore, the ad spending growth is projected at 7.7%.
- In 2024, the average ad spending per user in search advertising which is the largest market is estimated at $83.7 and currently valued at $61.5 billion.
- Similarly, in 2028, 54% of total ad spending is estimated to be generated from mobile devices.
By Most Popular Monetization Methods
 (Reference: statista.com)
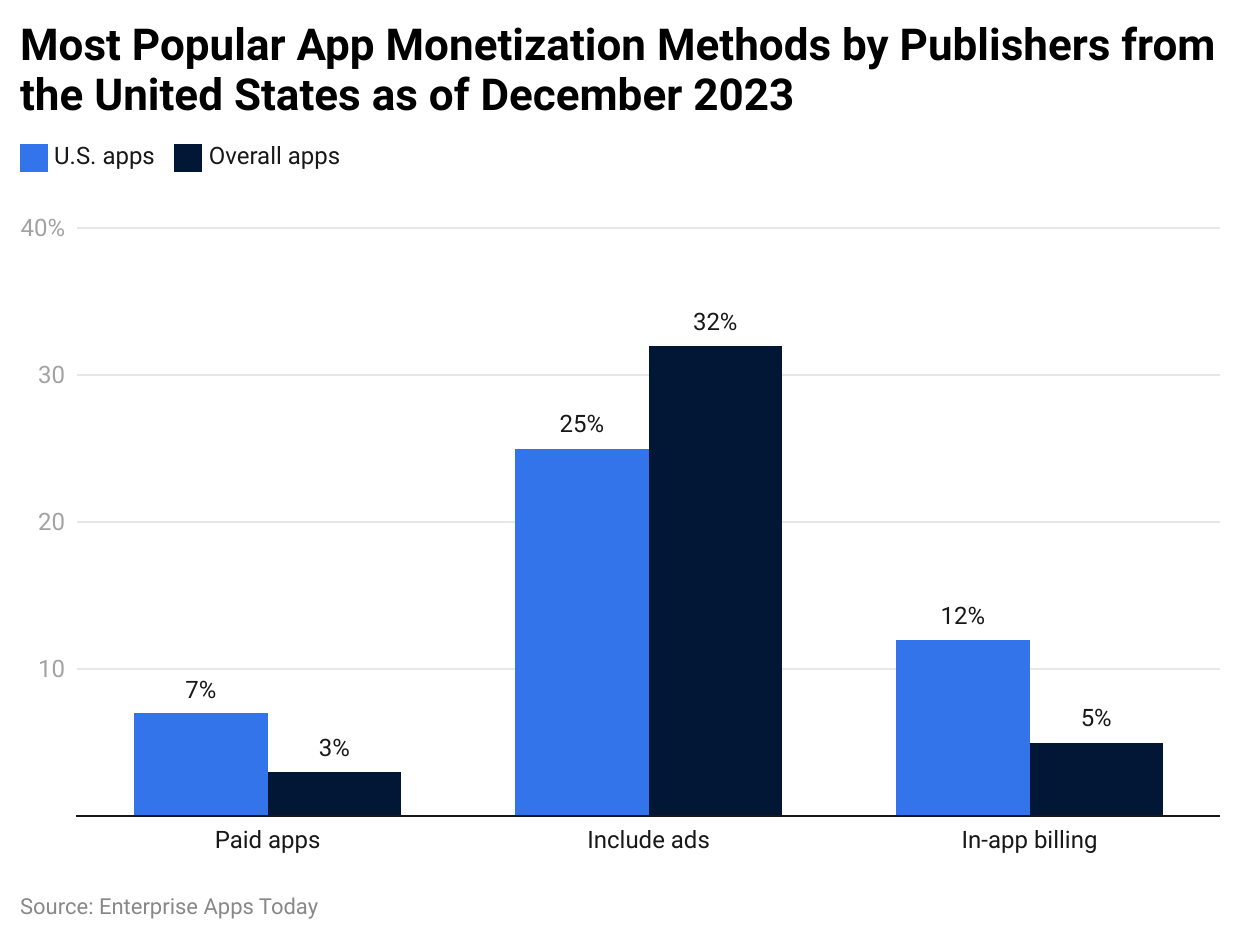
- According to Mobile Advertising Statistics 2023, the majority of the monetization through mobile advertising is made by ads, 32% of overall apps and 25% US specific apps contribute likewise.
- Furthermore, paid apps contribute by 7% – US apps, and 3% overall apps, while 12% and 5% go to in-app billing in similar methods.
By In-App Ads
By Most Popular In-App Ads
 (Reference: statista.com)
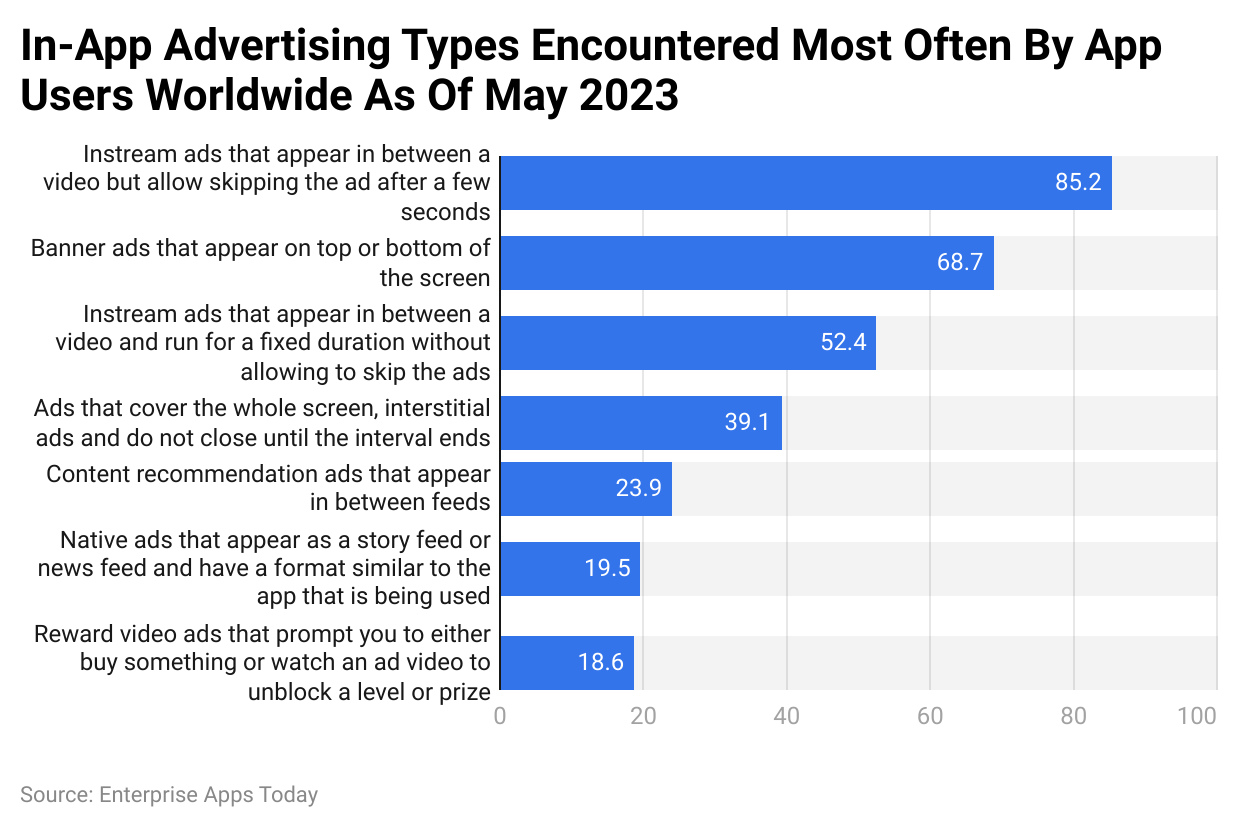
- In 2023 instream ads that are shown between a video and are allowed to skip after a few seconds are the most popular types of encountered apps by app users around the world contributing 85.2%.
- Furthermore, banner ads that appear on top and bottom (68.7%) and in-stream ads without any skip options (52.4%) are the other most seen types of mobile in-app ads.
- Global app advertising is projected to reach USD 280 billion by 2022, marking a 47% increase since 2019.
- In 2021, companies allocated 51% of their marketing budgets to mobile advertising.
- The number of advertisers using mobile ad networks grew by 5.79% in the first half of 2021.
- Mobile advertising spending is expected to increase by 26% to USD 241 billion.
- Companies increased their spending on branding campaigns in gaming apps by 19%.
- Paid ad campaigns resulted in a 15% increase in gaming app downloads compared to the previous year.
- The number of apps using mobile ad networks for revenue is set to grow by 60%.
- 77% of US users who block ads are willing to view certain ad formats, suggesting opportunities to engage even ad-averse users.
- Video ads in mobile apps have a 34% higher click-through rate (CTR) than native ads and 56% higher than banner ads.
- The CTR for in-app video ads has increased by 300%.
- Paid search ads in the Apple App Store convert at a rate of 50%.
- The average order value on mobile is over USD 84, while it’s approximately USD 122 on desktop devices.
- Mobile users remember app ads 47% of the time, slightly more than mobile web ads at 46% and much more than desktop ads at 36%.
- The use of mobile devices with ad-blocking services has reached 380 million, indicating widespread dislike for intrusive ads.
By Platforms Of Ads
- Gaming apps (25 percent)
- Social apps (23 percent)
- Streaming apps (15 percent)
- Mobile web pages (15 percent)
- News apps (14 percent)
(Source: drip.com)
The majority of the mobile ads appear on gaming apps contributing 25% of the total. Social apps, streaming apps, and mobile web apps contribute by 23%, and 15% each.14% of mobile ads are sent through news apps.
Conclusion
As stated in the Mobile Advertising Statistics, this type of advertising is cost-effective. It has a wider reach and can be presented in any creative way a human can think of. Moreover, mobile ads have easy access to the business’s product or service, thus just by clicking on it, there is a huge possibility of instance conversion. Moreover, depending on the group of audience these can be personalized. Mobile advertising is affordable for small-scale businesses also.
Thus, compared to traditional advertising, mobile ads have more flexibility in personalization and reach. Thus, In the coming years, the mobile advertising industry is expected to grow more notably.