

")
Introduction
Contents
- Introduction
- Editor’s Choice
- What is Smartwatch?
- General Smartwatches Statistics
- Smartwatches Market Size By Market.us
- By Brand Shipment
- By Operating System
- By Market Leaders
- By Demographics
- Smartwatch Users By Country
- Smartwatch Penetration Statistics
- By Region
- By Apps
- Smartwatches Statistics by Reason
- Why Do People Use Smartwatches?
- How are Smartwatches Being Used?
- Kids Smartwatch Statistics
- Conclusion
Smartwatches Statistics: In 2024, the global smartwatch market was valued at approximately USD 39.1 billion, with projections indicating a compound annual growth rate (CAGR) of 9%, potentially reaching USD 92 billion by 2034. Despite this growth trajectory, the market experienced a 7% year-over-year decline in shipments, marking its first-ever contraction .
Apple maintained its leading position with a 28% market share, although it faced a 19% decrease in shipments compared to the previous year. Conversely, Xiaomi emerged as a significant competitor, recording a remarkable 135% increase in sales and securing a position among the top five smartwatch manufacturers globally. The number of smartwatch users worldwide was estimated at 224.31 million in 2024, reflecting the growing adoption of wearable technology.
Regionally, China accounted for 28% of global smartwatch shipments, surpassing other countries in market share. These statistics underscore the dynamic nature of the smartwatch industry, highlighting both challenges and opportunities for stakeholders.
Editor’s Choice
- As of 2025, there are 454.69 million smartwatch users globally, marking a 41% increase from 323.99 million users in 2023.
- According to Market.us, the global smartwatch market is valued at approximately USD 50.57 billion in 2024.
- The market is projected to reach USD 138.7 billion by 2033, growing from USD 39.1 billion in 2023 at a CAGR of 13.5% from 2024 to 2033.
- The number of smartwatch users is expected to reach 740.53 million by 2029.
- In 2023, the North America smartwatch market was valued at USD 15.4 billion, accounting for 39.4% of the global market share.
- Apple holds a 21% share of the global smartwatch market.
- Android-based smartwatches held over 37.7% of the market share in 2023.
- OLED displays made up more than 88.5% of the smartwatch display market in 2023.
- The communication segment led with more than 35.0% market share in 2023.
- China controls 60% of the global cellular smartwatch market.
- About 92% of smartwatch users use them for health and fitness tracking.
- Individuals aged 35–54 represent 30% of smartwatch users.
- Users aged 55 and above constitute 15% of the total user base.
- Young adults aged 18–24 primarily use smartwatches for fitness and health monitoring.
- Around 35% of smartwatch users are male, while 28% are female.
- In the United States, 26% of households have access to a smartwatch.
- The expected global smartwatch market revenue for 2024 is USD 47.94 billion.
What is Smartwatch?
A smartwatch is an electronic wristwatch that is embedded with advanced technologies such as different types of biosensors, IoT, Bluetooth, and GPS. They allow you to answer calls, read text messages, emails, weather updates, etc. Other unique features of smartwatches are monitoring heart rate, sleep pattern, blood pressure, step counting, spatial detection, and fitness tracking. These smartwatches are available for different purposes including hiking, climbing, diving, aviation, and visual assistance.
As of 2023, top productions of smartwatches are Apple Watch SE, Apple Watch Series 7, Fitbit Sense, Fitbit Versa 3, Garmin D2 Delta PX, Garmin Descent Mk2 Series, Garmin Vivoactive 4, Mobvoi TicWatch Pro 3, Motorola Moto 360, Samsung Galaxy Watch4, and Suunto 9 Baro.
General Smartwatches Statistics
- According to report from Statista, revenue earned by the smartwatches market is projected to reach around $44.15 billion by the end of 2023.
- As Statista reports, the market volume of smartwatches is expected to reach around $62.46 billion by the end of 2028 with a market share of 7.19% from 2023 to 2028.
- The market penetration of smartwatches was 2.86% in 2023 and is expected to be 2.88% by the end of 2028.
- The average revenue earned per user of smartwatch industries is expected to be $201.20.
- As of 2023, revenue generated by China’s smartwatches market is expected to reach $16,920 million.
- According to reports, in September 2023, Apple launched a new series of smartwatches, Series 9, with best-selling features, which has achieved a significant environmental milestone.
- From 2022 to 2032, the global market for smartwatches is expected to be $164.7 million.
- According to Counterpoint research reports, by the end of September 2023, the global market share of smartwatches had grown by 11.1%, with almost 35 million shipments compared to last year.
Smartwatches Market Size By Market.us
- The Global Smartwatch Market is projected to reach USD 138.7 billion by 2033, growing from USD 39.1 billion in 2023 at a CAGR of 13.5% during 2024 to 2033.
- Android-based smartwatches held a dominant share of 37.7% in 2023 due to widespread Android smartphone usage.

- OLED displays led the smartwatch display segment in 2023 with a market share of 88.5%, driven by better color quality and energy efficiency.
- The Communication segment dominated with 35.0% market share in 2023, due to the demand for features like calling, messaging, and social media notifications.
- North America led the global smartwatch market in 2023, holding 39.4% share due to high smartphone adoption, advanced tech infrastructure, and health awareness.
- China accounted for 60% of all cellular smartwatch ownership worldwide, reflecting strong regional dominance.
- The global smartwatch user base stood at 24.31 million in 2024.
- Users aged 35–54 made up about 30% of smartwatch owners in 2024.
- Individuals aged 55 and above represented around 15% of smartwatch users.
- Young adults aged 18–24 primarily used smartwatches for fitness and health monitoring.
- Approximately 35% of smartwatch users in 2024 were male, while 28% were female.
- In the United States, 26% of households had access to a smartwatch in 2024.
- Smartwatch purchases in the U.S. have more than doubled since 2016.
By Brand Shipment

(Reference: counterpointresearch.com )
- In Q1 2024, Apple led global smartwatch shipments with a 21.6% market share.
- Fire-Boltt held 10.1%, followed by Samsung at 9.2%, Huawei at 8.8%, and Noise at 7.1%.
- Other brands collectively captured 43.2% of the market in Q1 2024.
- In Q4 2024, Apple again led with a 28% share, while Huawei and Xiaomi followed at 14% and 10%, respectively.
- In Q3 2023, Apple saw a 7% year-over-year growth, marking its best-ever Q3 performance.
- Huawei achieved a strong 56% year-over-year shipment growth in Q3 2023.
- The global smartwatch market is projected to grow 12% in 2024, reaching approximately 171.7 million units.
- From Q1 2022 to Q1 2023, Apple’s market share fell from 32% to 26%, with sales dropping below 10 million units for the first time in three years.
- Samsung experienced a 19% year-over-year shipment decline in Q2 2023, particularly in North America and Europe.
- In Q3 2023, India contributed 35% of global smartwatch shipments, leading the global market for the third consecutive quarter.
- Asia-Pacific held a 35% market share in 2023 and is projected to expand to 37% in 2024, driven by China and India.
- Fire-Boltt led the Indian market in Q3 2023, recording its highest quarterly shipments.
- Indian brands Noise and boAt also saw notable growth during this period.
- In Q2 2024, global wearable band shipments grew by 0.2%, totaling 44.3 million units.
- Basic watches made up 48% of this segment, their highest recorded share.
- Garmin increased its shipments by 16% in Q2 2024 due to high demand and stronger advertising.
- In Q4 2024, HLOS smartwatches dominated the North American market with an 88% share, led by Apple, Samsung, and Garmin.
- Xiaomi achieved its highest wearable band shipment since Q4 2020, driven by the Mi Band 9 and Redmi Watch 5.
- Huawei’s Q4 2024 growth was fueled by the success of its Watch 4 and Watch 4 Pro series.
- In Q1 2023, Apple held a 26% share, followed by Samsung and Fire-Boltt, each at 9%.
- In Q2 2023, Apple had 22%, with Huawei and Noise each holding 10%.
- In Q3 2023, Apple remained at 22%, with Fire-Boltt at 10% and Huawei at 9%.
By Operating System
- watchOS (Apple) holds a 31% share of the global smartwatch OS market.
- Wear OS (Google) has increased its market share to 27%, up from 21% in the previous year.
- Proprietary operating systems used by brands like Fitbit and Garmin account for the remaining 42% of the market.
- In the United States, iOS maintains a dominant position with a 57.6% share of the mobile operating system market.
- Globally, Android leads the mobile OS market with a 72.23% share, while iOS holds 27.39%.
By Market Leaders
(Source: mordorintelligence.com)
- According to Juniper Research analysis, the four biggest market leaders of Smartwatches—Apple, Fossil, Fitbit, and Samsung—are predicted to hold a market share of 47% by the end of 2023.
- According to Business of Apps reports, Apple Inc.’s total revenue in 2023 is supposed to be $383.2 billion.
- According to reports from Apple World Today, in the 2nd quarter of 2023, Apple sold 8.1 million smartwatches, which accounted for an 18% market share.

(Reference: mordorintelligence.com)
- As of 2023 reports, the market of Apple Smartwatch is expected to be 32% of the share.
- In 2023, Samsung OS Smartwatch brands are termed as the world’s best-selling wearable with a market share above 10% around the world.
- As of the above graph analysis, in 2023 market share of top manufacturers of Smartwatches is followed by Huawei (7%), Garmin (4%), Fitbit (1%), and others (46%).
By Demographics
- 60% of smartwatch users are male, while 40% are female, according to ISP.
- 23% of men worldwide own a smartwatch compared to 21.8% of women.
- Among internet users aged 25 to 34, 27.2% of women and 26.9% of men own smartwatches, indicating higher adoption among females in this age group.
- In the 16 to 24 years age group, 21.0% of men and 19.6% of women are smartwatch users.
- For users aged 35 to 44 years, 25.5% of men and 24.5% of women own a smartwatch.
- In the 45 to 54 years segment, 20.9% of men and 18.6% of women use smartwatches.
- Among those aged 55 to 64 years, 16.1% of men and 12.7% of women are smartwatch users.
- 24% of people living in suburban areas use smartwatches.
- 20% of urban residents reported using smartwatches.
- 18% of individuals in rural areas use smartwatches, showing a relatively small gap compared to urban regions.
Smartwatch Users By Country
- 26.5% of internet users in Poland use a smartwatch or fitness tracker, the highest usage rate globally.
- 20.9% of internet users in China use smart wristband devices.
- 15.0% of internet users in the United Kingdom are smartwatch users.
- 14.5% of internet users in Germany use wearable wristbands.
- 13.8% of internet users in India actively use smartwatches or fitness trackers.
- 12.2% of Americans use either a smartwatch or fitness tracker.
- 12.1% of internet users in France are smartwatch users.
- 2.4% of internet users in Japan wear smart wristbands.
- 2.1% of internet users in Morocco use wearable wristband devices, the lowest share globally.
- Globally, 14.4% of the world’s population uses a smart wristband device.
Smartwatch Penetration Statistics
- The global smartwatch user penetration rate is forecasted to reach 2.88% by 2028.
- The penetration rate was 2.89% in 2027 and 2.90% in both 2026 and 2025.
- In 2024, the smartwatch user penetration rate was recorded at 2.89%.
- The rate stood at 2.86% in 2023 and 2.78% in 2022.
- In 2021, the user penetration rate was 2.69%, while in 2020 it was 2.50%.
- The earliest recorded data shows a penetration rate of 2.01% in 2019.
- Between 2023 and 2028, the global smartwatch user penetration rate is expected to grow by 0.02%.

(Source: kantar.com)
- In Q3 2021, Australia recorded the highest smartwatch penetration at 16.9%, up from 13.7% in 2020 and 11.1% in 2019.
- The United States followed closely with a penetration rate of 15.0%, rising from 11.6% in Q3 2020 and 10.3% in Q3 2019.
- Italy reported a smartwatch penetration of 14.3% in Q3 2021, compared to 10.8% in 2020 and 9.0% in 2019.
- Great Britain saw penetration increase to 14.1% in Q3 2021, from 11.3% in 2020 and 9.0% in 2019.
- Germany reported a smartwatch usage rate of 11.3% in Q3 2021, up from 8.7% in 2020 and 8.4% in 2019.
- France reached 10.2% penetration in Q3 2021, increasing from 7.6% in 2020 and 5.6% in 2019.
- Japan had the lowest smartwatch penetration, standing at 4.2% in Q3 2021, up from 3.3% in 2020 and 3.0% in 2019.
- The Apple Watch accounted for 63% of smartwatch sales in the latest quarter, reflecting a 4 percentage point year-on-year increase.
- Samsung held a 12% share of smartwatch sales, down by 4 percentage points compared to the previous year.
- Fitbit increased its share of smartwatch sales to 12%, rising 2 percentage points year on year, while its share of the installed base declined by 2 percentage points.
- Internet sales contributed to 71% of total smartwatch sales, showing a 5 percentage point increase year on year.
- 28% of smartwatch buyers reported visiting the manufacturer’s website before purchasing.
- 23% of buyers visited a retailer’s website such as Best Buy prior to purchase.
- Only 15% of smartwatch buyers were influenced by promotions in Q3.
- 63% of smartwatch buyers in the United States purchased their device to improve health and fitness, representing a 7 percentage point year-on-year increase.
- The importance of brand as a purchasing factor declined to 55%, down from 63% in the previous year.
- The preference for operating system as a deciding factor increased by 2 percentage points.
- Key features such as battery life and cross-platform support were increasingly cited as important by buyers.
By Region
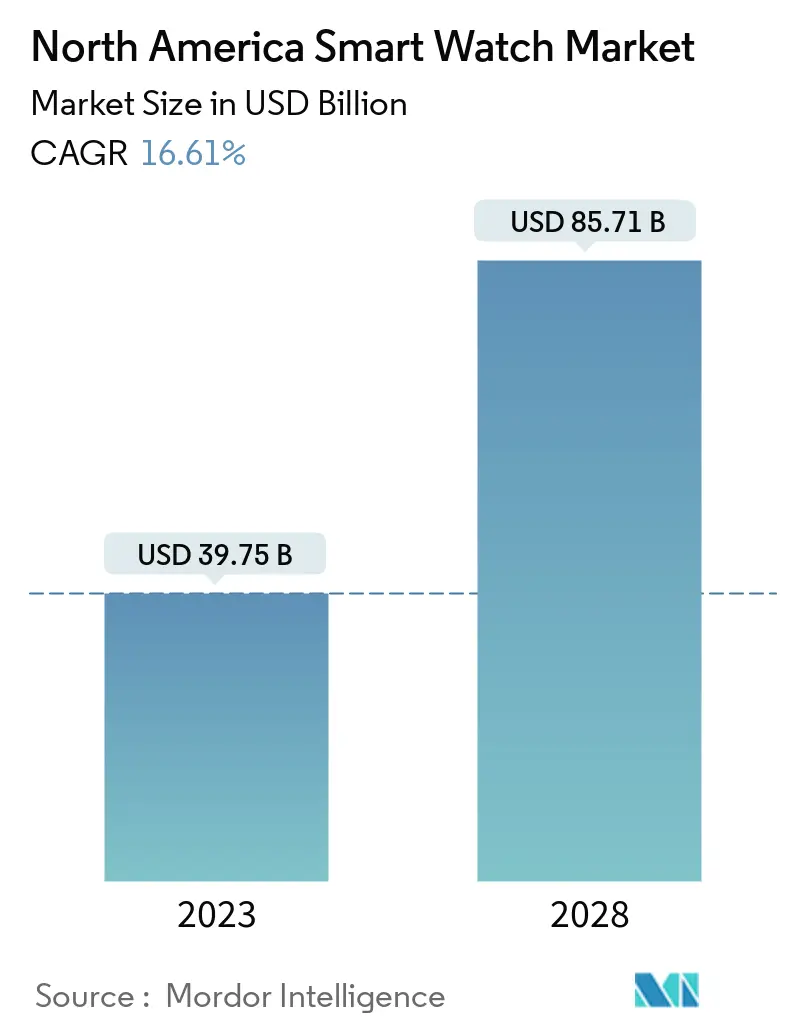
(Source: mordorintelligence.com)
- According to the above graph analysis, the North American Smart Watch market is expected to reach around $39.75 billion in 2023 and $85.71 billion by the end of 2028, with a CAGR of 16.61%.
- The market size of the European Smart Watch is supposed to reach around $5.51 billion by 2023 and $9.27 billion by the end of 2028, with a CAGR of 9.79% from 2023 to 2028.
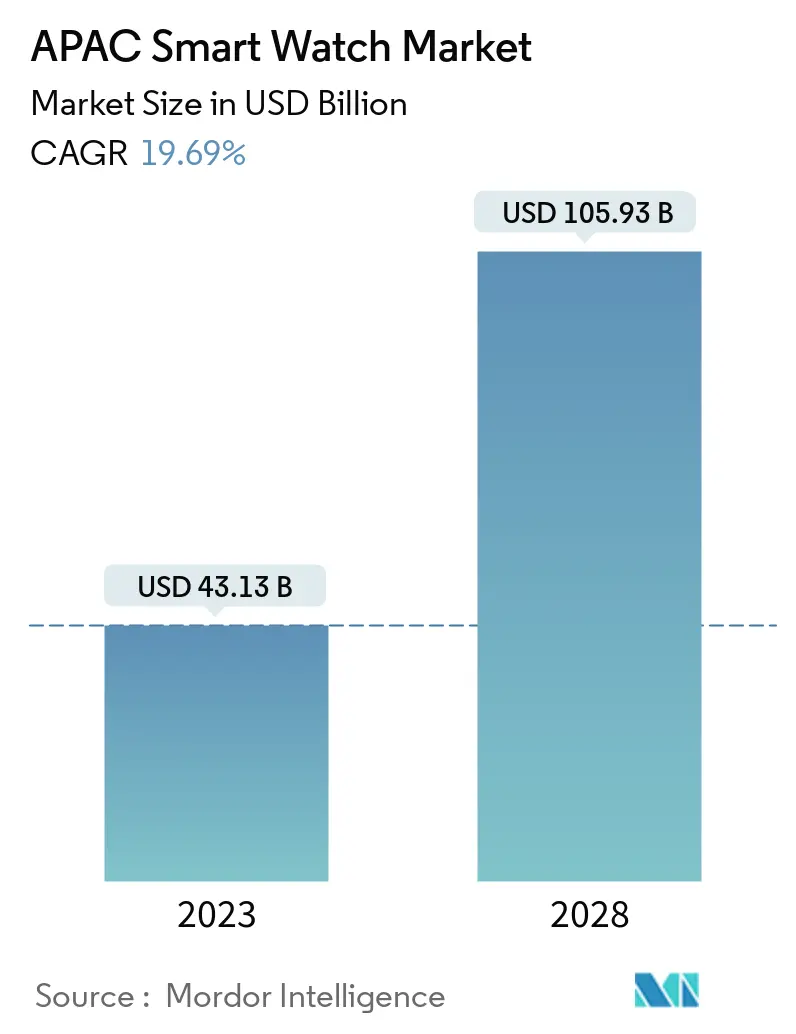
(Source: mordorintelligence.com)
- According to the above graph analysis, the market size of Asia Pacific Smart Watch is expected to reach between $43.13 billion and $105.93 billion by the end of 2028, with a CAGR of 19.69% from 2023 to 2028.
- The market share of Smartwatches in Latin America and the Middle East region is expected to grow at a CAGR of 13.40% and 5.2%, respectively, from 2023 to 2028.
- According to Allied Market Research analysis, the United Kingdom held the highest market share in the European region, and Italy was the fastest-growing country in the smartwatch market, with a CAGR of 15.47%.
By Apps

(Reference: mordorintelligence.com)
- Smartwatches ‘ leading fitness and sports apps are My Fitness Pal, Fitbit, Strava, WW, Workouts by Muscles Booster, Peloton, Fitness Coach, and amp; Diet, Noom, and Keep.
- According to the above graph analysis, the market share of apps in 2022 is followed by My Fitness Pal ($8.98 million), Fltbit ($8.14 million), Strava ($5.66 million), WW ($5.56 million), Workouts by Muscle Booster ($3.69 million), Peloton ($3.5 million), Fitness Coach and amp; Diet ($2.74 million), Noom ($2.32 million), and Keep ($2.18 million).
Smartwatches Statistics by Reason
- As to reports, the main reason for using smartwatches is to help in tracking and maintaining health and fitness (92%).
- Furthermore, other reasons are followed by allowing users to achieve fitness goals (88%),
helping users in doing regular exercises (48%), and increasing steps (34%). - GenZ (56%) and Millennials (46%) use smartwatches for tracking sleep and heart rate.
Why Do People Use Smartwatches?
- 92% of people use smartwatches to track and maintain their health and fitness.
- 88% of smartwatch users stated that it helped them to achieve their fitness goals.
- 48% of users use smartwatches to ensure they exercise regularly.
- 42% of users have shared smartwatch data with healthcare providers for better health insights.
- 34% of smartwatch users rely on it to increase their daily step count.
- 56% of Gen Z and 46% of millennials use smartwatches to monitor heart rate and sleep.
How are Smartwatches Being Used?
- 74% of U.S. smartwatch users who self-purchased reported using their device to track fitness and health, a +3% increase from the previous year.
- The step counter remains the most used fitness feature, with 74% of users utilizing it, up +4% year on year.
- Sleep tracking is an emerging use case, especially for Apple Watch users. 18% cite it as a feature they actively use, a +3% rise from last year.
- Tracking overall active time and stairs climbed also showed an increase in usage among health-conscious users.
- Other intended smartwatch activities such as checking the weather declined by -5% compared to the previous year.
- Engagement is highest in the first 6 months after purchase, with features like checking calendars, weather, and making voice calls most frequently used.
- Between 6 to 11 months, there is a notable decline in usage, with many owners reducing or stopping smartwatch interactions.
- Weekly usage has declined across 14 tracked activities, indicating a broader issue of sustained engagement.
- The functionalities experiencing the greatest drop in weekly usage include sending/receiving text messages, viewing notifications, making/taking voice calls, and listening to music via wireless headphones.
- 3 out of 4 buyers in the U.S. primarily purchase smartwatches for health and fitness tracking, reaffirming it as the dominant use case.

(Reference: statcdn.com)
Kids Smartwatch Statistics
- The global kids smartwatch market is expected to grow from USD 1.5 billion in 2023 to approximately USD 5.8 billion by 2033, with a CAGR of 14.5% during 2024 to 2033.
- In 2023, North America held a 38.1% market share, supported by strong consumer awareness and rising demand for GPS-enabled child safety features.

- The Integrated product type dominated in 2023 with a 66% market share, due to multifunctionality including health tracking, entertainment, and location monitoring.
- Android-based smartwatches accounted for 53% of the market in 2023, driven by affordability and wide regional adoption.
- Individual use represented 64% of total demand in 2023, as parents preferred direct communication and live tracking capabilities.
- Online sales channels captured 41% of total sales in 2023, fueled by easy access, broad selection, and competitive pricing.
- 80% of parents considered GPS tracking the most important feature in a kids smartwatch, showing strong emphasis on safety.
- 60% of children aged 7 to 12 either owned or frequently used a smartwatch in 2023, marking them as the dominant user segment.
- The price range for kids smartwatches varied from USD 50 to over USD 300, based on brand and features.
- The average product lifespan is 2 to 3 years, mainly influenced by battery life.
- Privacy and data concerns are notable, with 40% of consumers hesitant due to fear of children’s data breaches.
- VTech Holdings reported USD 2,241.7 million in revenue for FY2023, reflecting a 5.4% year-on-year decline, while net profit fell by 13.6% to USD 149.2 million.
- VTech sustained a gross profit margin of 28.3% and paid a full-year dividend of USD 0.59 per share despite the downturn.
- Market competition is increasing with new product entries such as Fitbit Ace LTE, AT&T’s amiGO Jr., and Apple’s sub-USD 200 models.
Conclusion
As of today, after completing the article on smartwatch statistics it can be stated that this portable device is unobtrusive and easy to carry. They are included with a variety of healthcare applications, which is possible only due to the availability of advanced technology those are supplied with biosensors. Several effective statistics are described elaborately above and hope all the above information will help you understand the detailed market analysis of smartwatches.
If still you are not using one then, surely after going through this article you will be purchasing a smartwatch for yourself.